Beginner
Featured
Data Science & AI
Python for Data Science & Analytics
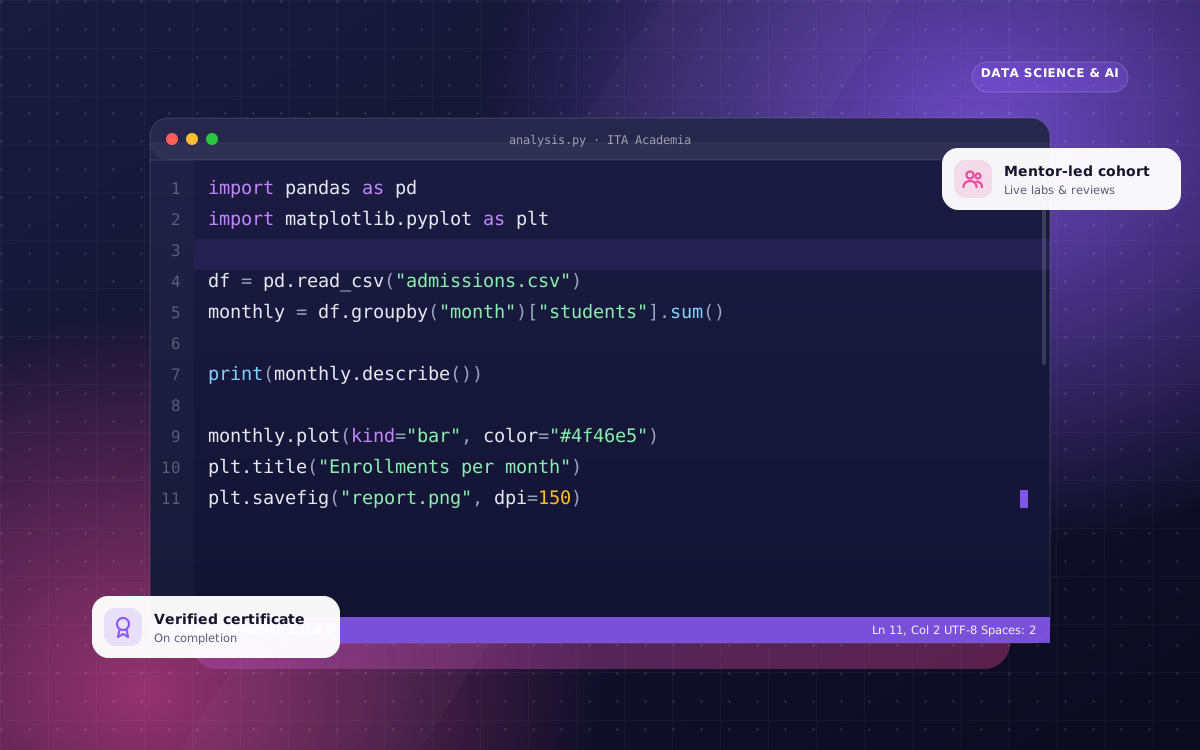
From Python basics to Pandas, NumPy, Matplotlib and SQL - analyse real datasets and present insights that driv...
Turn spreadsheets into executive dashboards - advanced Excel, Power Query, DAX and Power BI storytelling for business analysts.
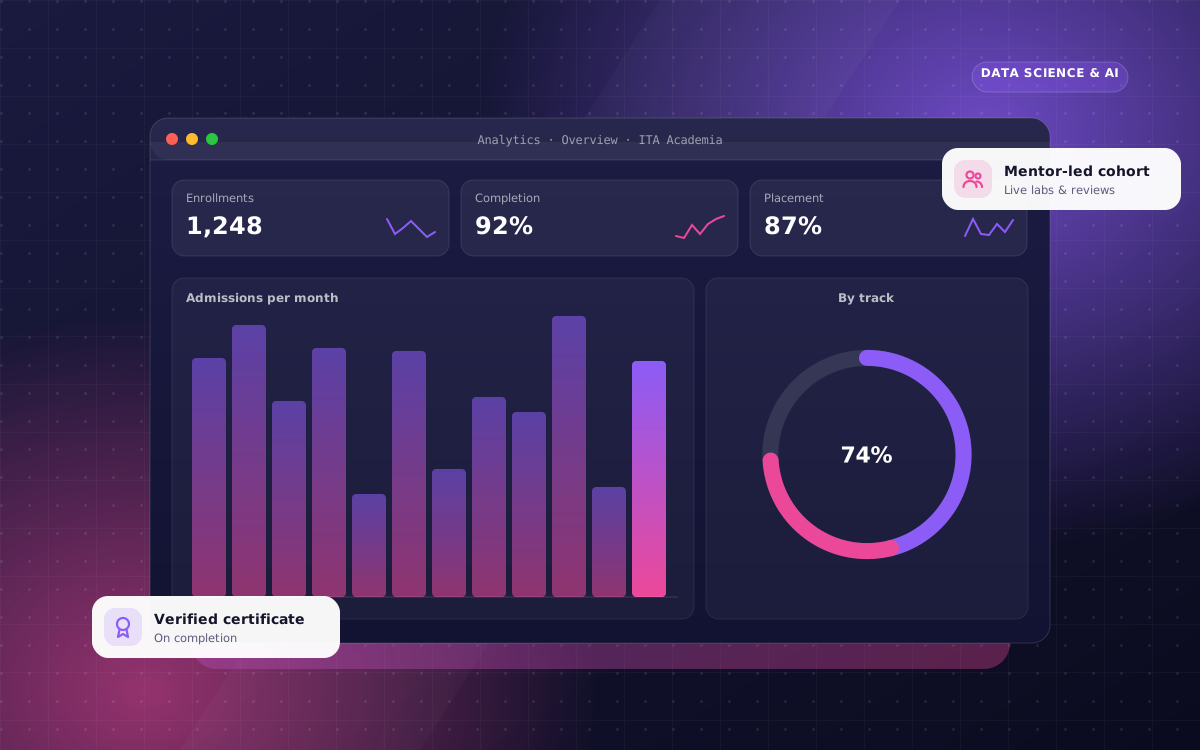
Turn spreadsheets into executive dashboards - advanced Excel, Power Query, DAX and Power BI storytelling for business analysts.
The Data Analytics with Power BI & Advanced Excel program at ITA Academia is a 8-week, mentor-led track designed around real industry workflows. Every module combines live instruction with guided labs, and ends with a graded deliverable that goes straight into your portfolio.
Graduates receive an ITA Academia verified certificate of completion and a transcript of assessed projects. Selected students are recommended to hiring partners and internship programs.
No prior experience required. Basic computer literacy and a laptop are recommended.
Hands-on sessions, guided labs and a graded assignment covering advanced excel functions.
Hands-on sessions, guided labs and a graded assignment covering pivot tables & power query.
Hands-on sessions, guided labs and a graded assignment covering power bi desktop & data modeling.
Hands-on sessions, guided labs and a graded assignment covering dax measures.
Hands-on sessions, guided labs and a graded assignment covering dashboard design.
Hands-on sessions, guided labs and a graded assignment covering publishing & governance.
Hands-on sessions, guided labs and a graded assignment covering business case project.

Sarah bridges academia and industry - she supervises MS/PhD research analysis and teaches Python for data-driven decision making.
From Python basics to Pandas, NumPy, Matplotlib and SQL - analyse real datasets and present insights that driv...
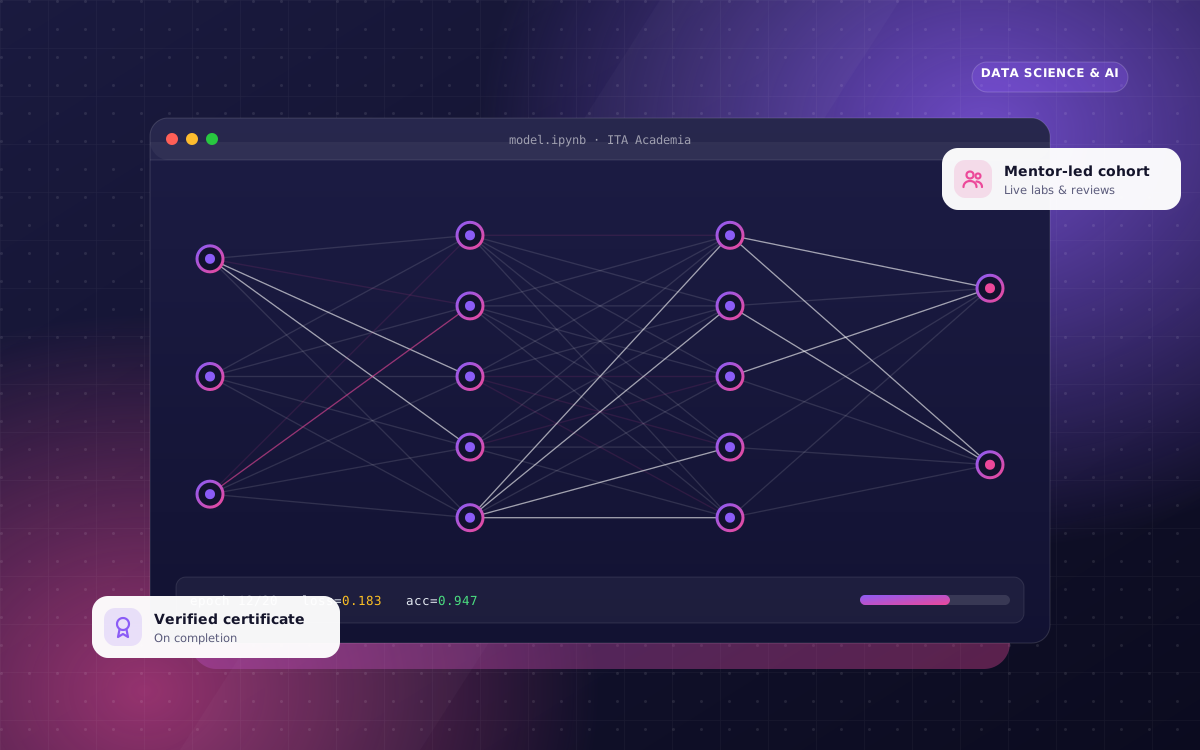
Neural networks, transformers and applied ML workflows - train, evaluate and deploy models with scikit-learn,...
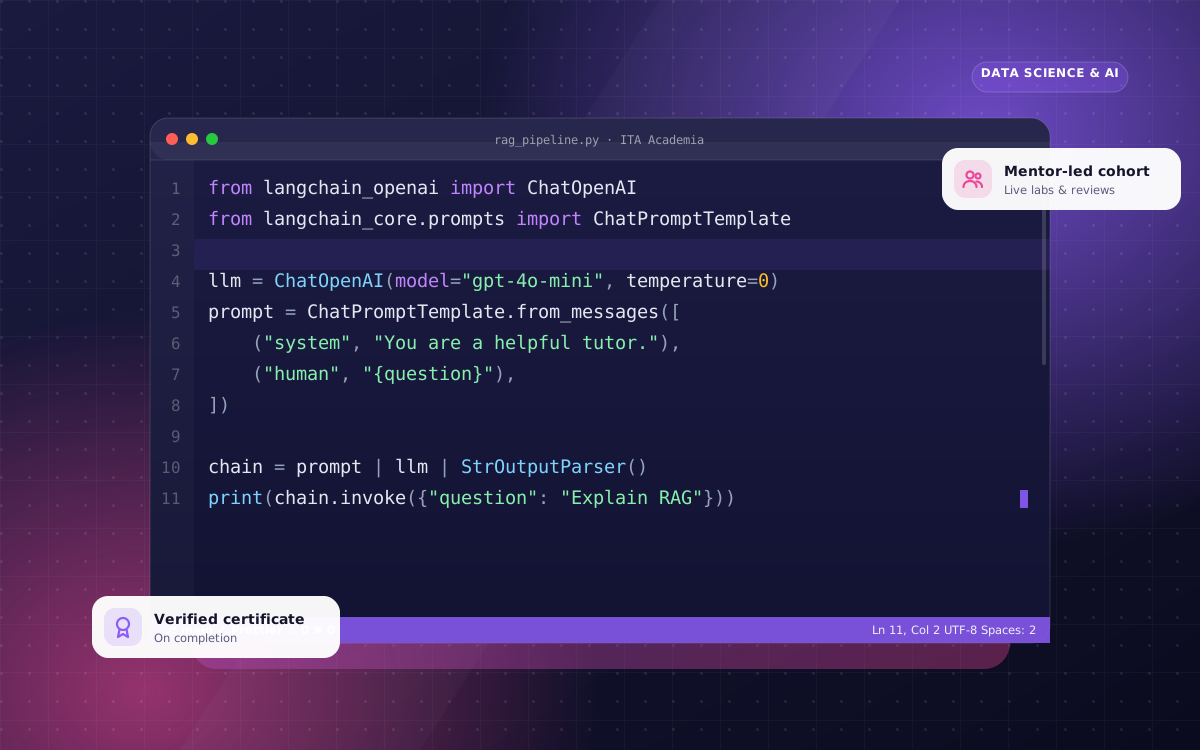
CNNs, RNNs, diffusion models and LLM application development with LangChain, vector databases and RAG pipeline...